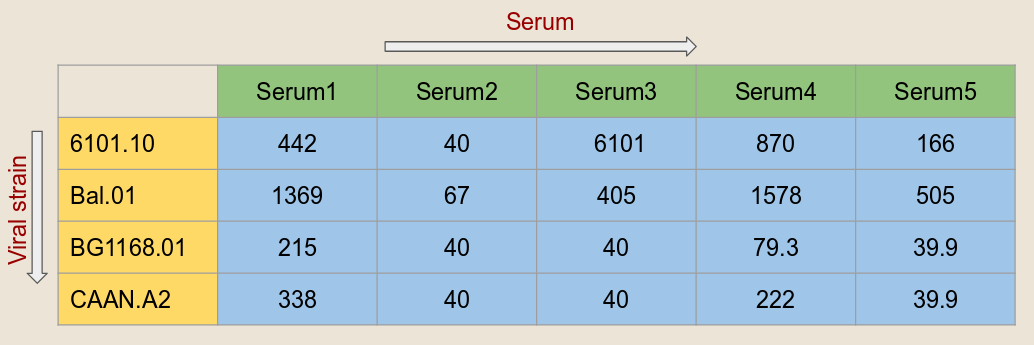
Input data: The required input is the serum neutralization data for a set of viral strains in the format given below. All the columns should be tab (\t) separated.
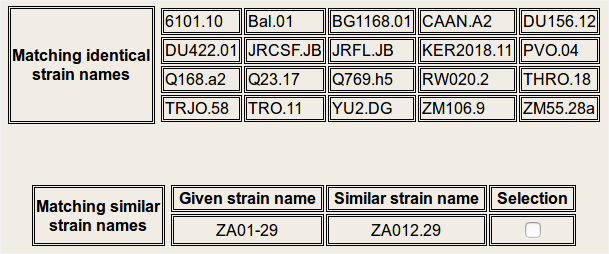
Viral strain selection: In this step, the user provided, viral strain names are cross-checked against our database and two lists of viral strain names are displayed: Identical and Similar. The identical viral strain names will be automatically included in the analysis. Based on the user selection, similar viral strain names may or may not be included in the analysis.
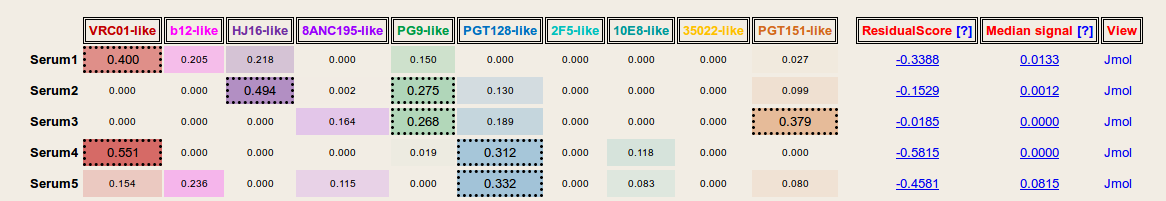
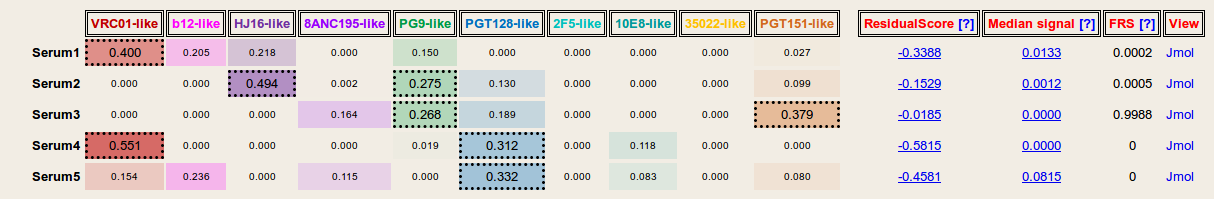
Result: Based on the given serum neutralization data and viral strain selection, NFPws predicts the prevalence of 10 epitope-specific broadly neutralizing antibody groups for each serum. Antibody specificity values >=0.25 for each serum are displayed with dashed borders. Further, NFPws also computes and displays normalized residual scores and median signal values, which can be used as an indicator of potential serum delineation errors. Higher normalized residual scores and higher median signal values may be associated with higher delineation errors. NFPws also provides an option to download the serum delineation results as a text file.
Results (with computation of Frequency of random signals): In addition to outputting predicted antibody specificities and validation measures, NFPws can also evaluate serum neutralization patterns for the presence of random antibody neutralization signals. A higher frequency value may be associated with a higher serum delineation error.
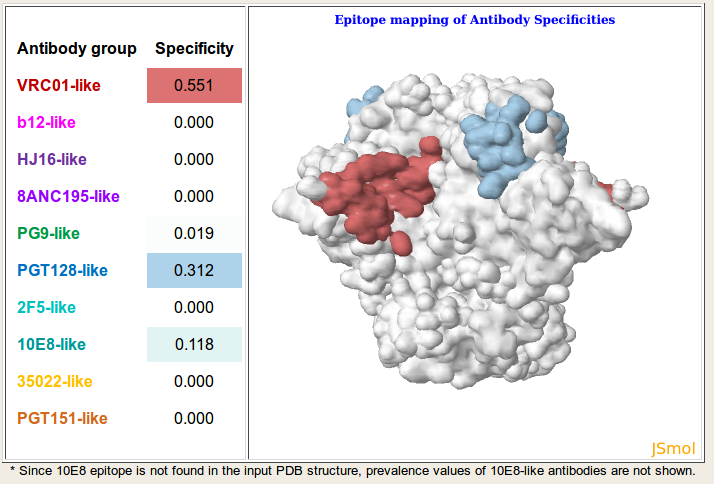
Visualization: On the results page, a jsmol viewer link is provided for each serum to visualize the predicted types of antibody specificities by mapping the respective epitopes to a representative structure of gp140 (PDB-id: 5FYK). The surface representation is colored based on the same antibody color spectrum as in the output table, and the density of the color is based on the respective prevalence values.